


Table of Contents
Categories
Most Popular


User drop-off rate refers to the percentage of users who abandon a process before completing a desired action. Every marketing manager knows the frustration of seeing potential customers start to sign up, fill a cart, or begin a free trial—only to leave mid-way. These user drop-offs directly impact your conversion rates and ROI, making drop-off rate a critical metric to monitor.
In this comprehensive guide, we’ll explore what the drop-off rate is, how to calculate it, common causes of high drop-off rates, and effective strategies and tools to identify and reduce drop-off rates in your marketing and product interaction funnel.
What is User Drop-Off Rate?
Drop-off rate is the percentage of users who start a multi-step process but do not finish it.
In other words, it quantifies how many people “drop off” along the way toward a conversion goal. For example, if 1,000 users begin a sign-up form and only 700 complete it, 300 users dropped off, yielding a drop-off rate of 30%.
This metric is crucial for growth marketing, as well as product journey design because it highlights points in the user journey where potential customers may leave.
Drop-Off Rate Vs. Bounce Rate Vs. Exit Rate
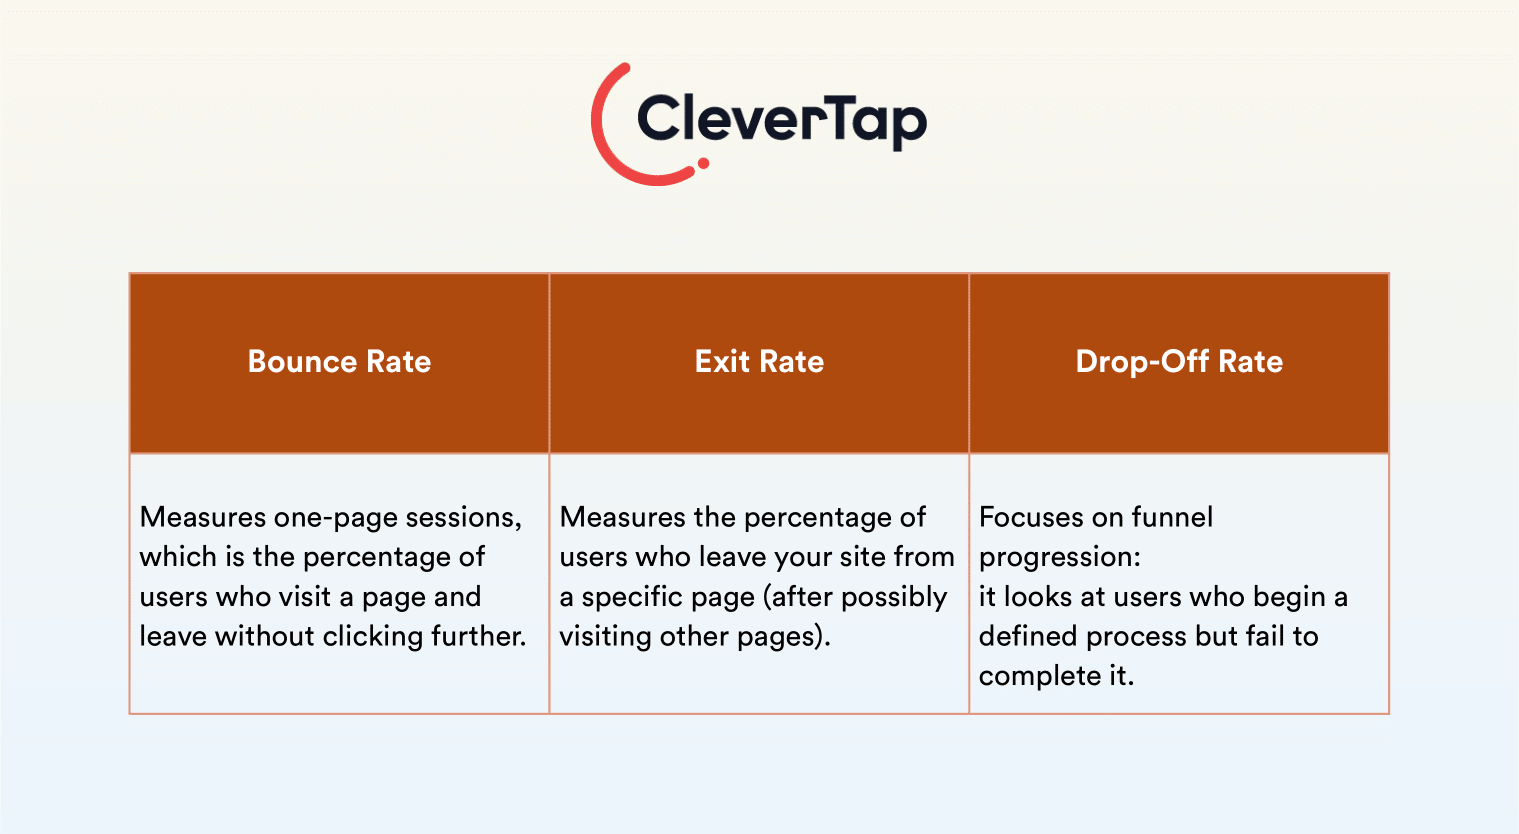
It’s important to understand what drop-off rate is not. Let’s clarify the differences between drop-off rate, bounce rate, and exit rate.
- A bounce rate measures one-page sessions, which is the percentage of users who visit a page and leave without clicking further.
- An exit rate is the percentage of users who leave your site from a specific page (after possibly visiting other pages).
- Drop-off rate, on the other hand, focuses on funnel progression: it looks at users who begin a defined process (such as a sign-up flow, checkout funnel, or onboarding sequence) but fail to complete it.
Unlike a bounce or exit (which can happen anywhere), a drop-off implies the user started an intended journey and then abandoned it before the finish line. For example, a user might navigate through three steps of a product purchase funnel and leave on the fourth step—that is a drop-off at that stage of the funnel.
Bounce and exit rates relate to page behavior, whereas the user drop-off rate is about failing to convert in a multi-step flow.
Monitoring the drop-off rate (sometimes referred to as the funnel drop-off rate) for your key processes provides a targeted view of where users lose interest or encounter friction. A high drop-off rate at a particular step means something on that step is causing users to quit.
Importance of Monitoring User Drop-Off Rates
Tracking drop-off rates is essential for improving your marketing performance. By keeping a close eye on where users leave, you can take action to plug the leaks. Here are a few key reasons why monitoring drop-off rates matters:
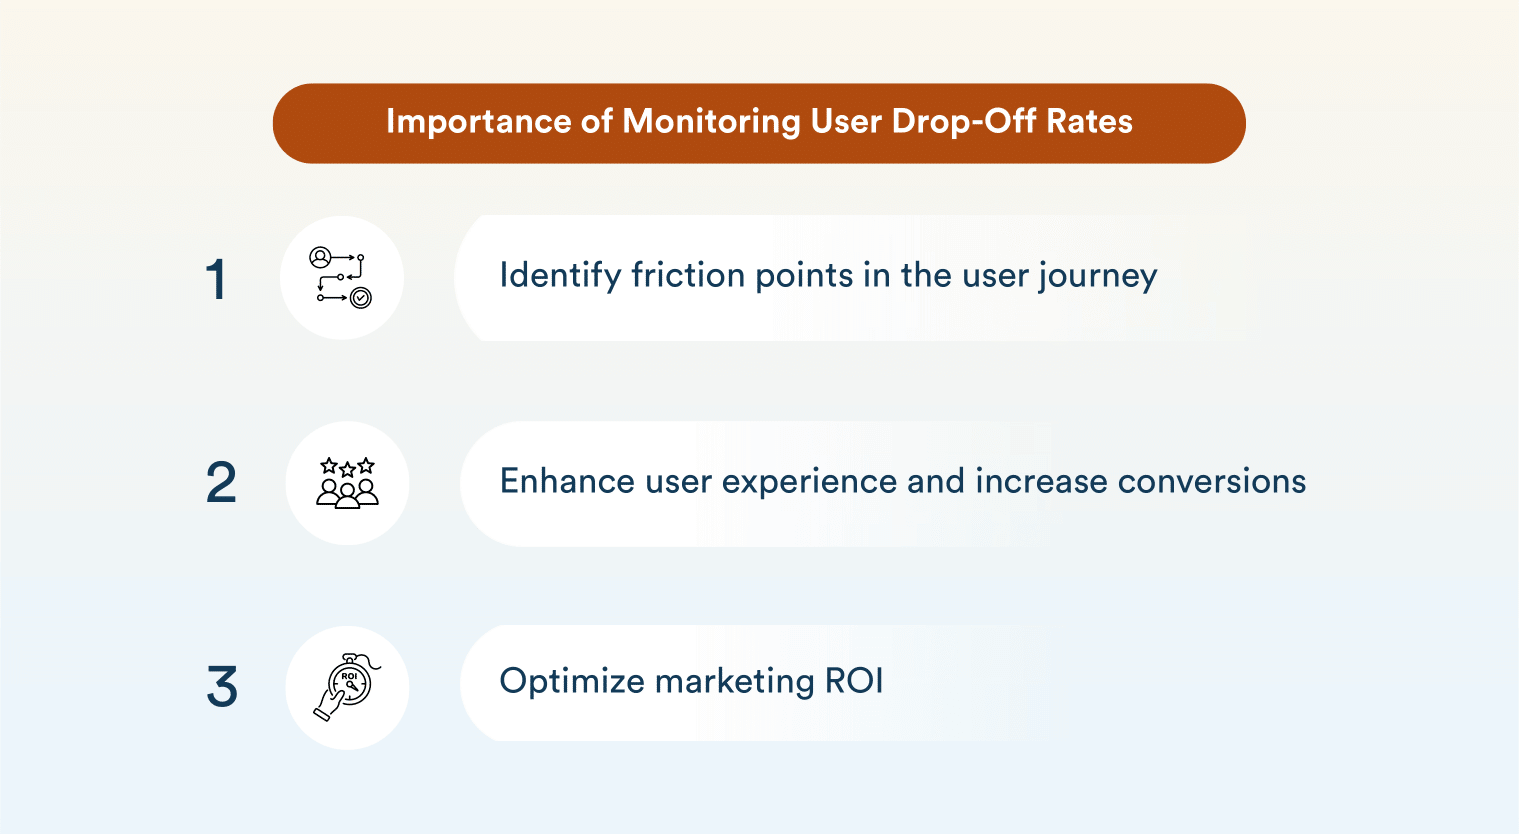
- Identify Friction Points in the User Journey: Drop-off rate analysis highlights where users are getting stuck or frustrated, so you know exactly which stage of the funnel needs attention. For instance, if many users drop off on the payment page of your checkout funnel, it flags a potential issue (like a complicated form or unexpected cost) at that step. By pinpointing these high drop-off points, you know exactly which stage of the funnel needs attention.
- Enhance User Experience and Increase Conversions: When you address the sources of drop-off, you create a smoother user experience. Reducing friction keeps users engaged through each step. This naturally leads to higher completion rates and improved conversions.
- Optimize Marketing ROI: Bringing users to your website or app costs time and money. If a large portion of them drops off before converting, that investment is wasted. By continuously monitoring and improving drop-off rates, you can maximize the return on acquisition efforts.
Paying attention to drop-off metrics helps you make data-driven improvements to the funnel, ensuring that you’re not unknowingly losing a huge chunk of interested users at a preventable step.
How to Calculate User Drop-Off Rate
To calculate user drop-off rate, compare the number of users who started a process to the number who completed it and see what percentage did not complete.
You can calculate the drop-off rate, using this formula:

Drop-Off Rate = (Number of users who didn’t complete the process / Number of users who started the process) x 100%
Which translates to:
Drop-Off Rate = (Number of users who started the process – Number of users who completed the process) / (Number who started) × 100%
This will give you a percentage of users who abandoned the funnel at a given stage.
Example: How to Calculate Drop-Off Rate with Sample Data
Let’s walk through a simple example of how to calculate drop-off rate. Suppose 500 people begin an online checkout process. Out of those 500, only 350 actually finish the checkout and purchase the product. That means 150 users started checkout but didn’t complete it. We calculate the drop-off rate as follows:
- Number of users who started: 500
- Number of users who didn’t complete (dropped off): 500 – 350 = 150
Now plug these into the formula: (150 ÷ 500) × 100 = 30%. The drop-off rate in this example is 30%. This indicates that nearly one-third of users who entered the checkout funnel ultimately abandoned it.
In a real-world scenario, you would calculate drop-off rates for each step of a multi-step funnel.
For instance, Step 1 (Product Page to Cart), Step 2 (Cart to Checkout Start), Step 3 (Checkout Start to Payment), and so on, to see where the largest percentage of users are falling off. Knowing how to calculate drop off rate at each stage allows marketers to quantify the severity of abandonment and prioritize which stages need the most improvement.
Common Causes of High User Drop-Off Rates
If your drop-off rate is higher than you’d like, it’s important to diagnose why users are leaving. Here are some common causes of high drop-off rates in funnels and processes:
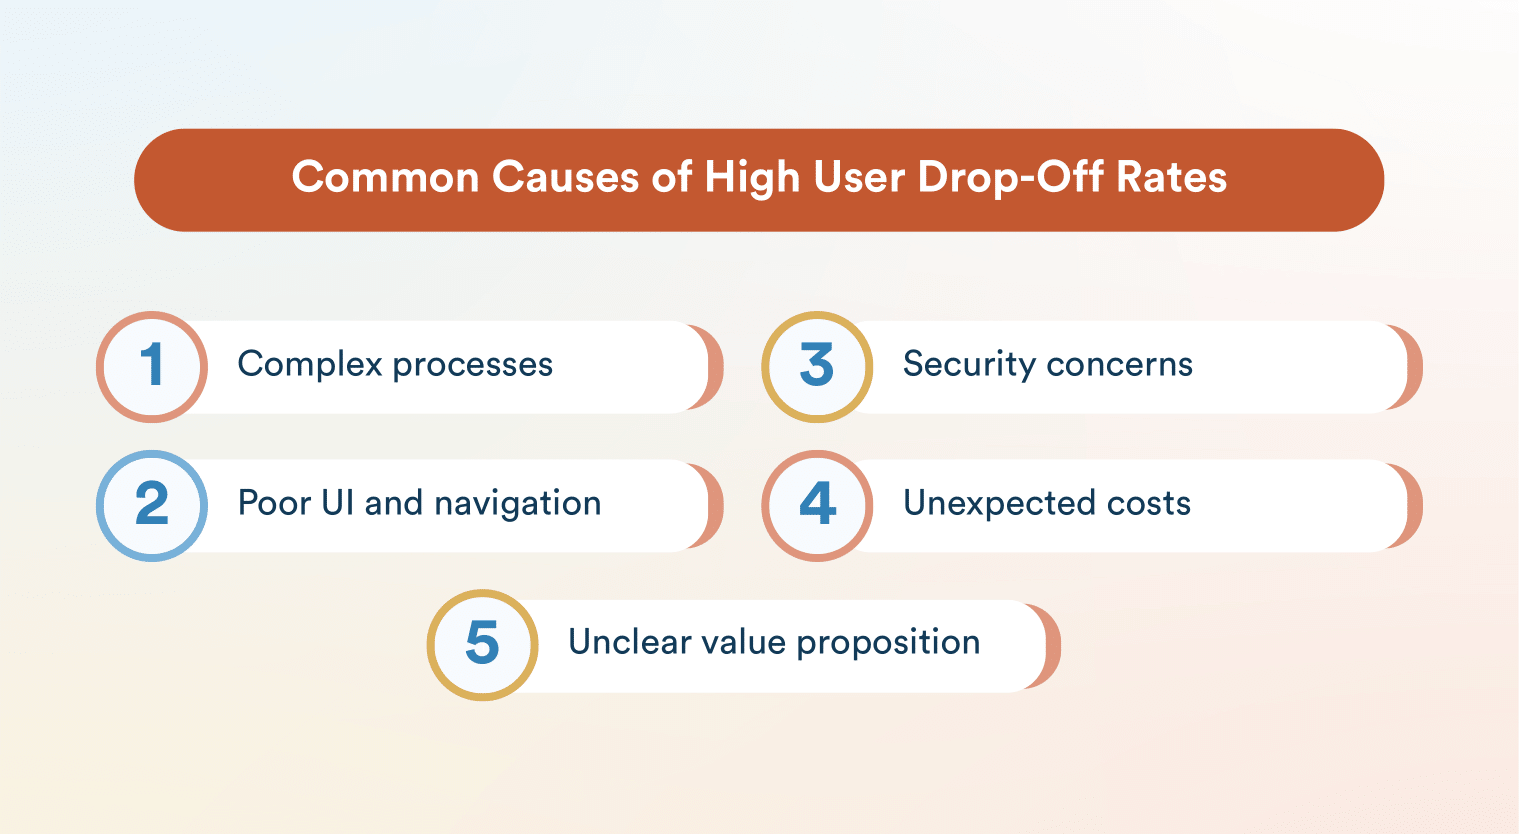
Complex Or Lengthy Processes
If your user journey involves too many steps or overly complex forms, users may give up. Long registration forms with excessive fields, multi-page checkouts, or convoluted sign-up procedures can all lead to frustration. Every additional hurdle is an opportunity for the user to drop off.
Poor User Interface Or Navigation Issues
A confusing UI can derail users mid-process. If buttons are hard to find, the next step isn’t obvious, or the page layout is cluttered, users might abandon out of confusion.
Navigation problems—such as broken links, a missing progress indicator, or a back button that doesn’t work—also contribute to drop-offs by disrupting the flow.
Lack Of Trust Signals Or Security Concerns
Users need to feel confident and secure, especially when they’re about to share personal information or payment details. If your checkout or sign-up page lacks trust signals, users might hesitate and drop off. For example, missing SSL badges, a lack of a privacy policy, or a general look and feel that seems unprofessional can scare users away. Similarly, if the value proposition is unclear, users may not trust that it’s worth completing the process.
Unexpected Costs Or Unclear Value Propositions
Surprise costs at the last minute are a big reason for user drop-offs. If a user reaches the final step and sees high shipping fees or unexpected extra charges, they often abandon the process.
Likewise, if the user isn’t convinced of the value they’ll receive, they may not bother completing the action. In short, any unpleasant surprise or lack of clarity can cause users to drop off before converting.
Strategies to Reduce User Drop-Off Rates
Here are several effective strategies to reduce drop-off rates in your funnel:
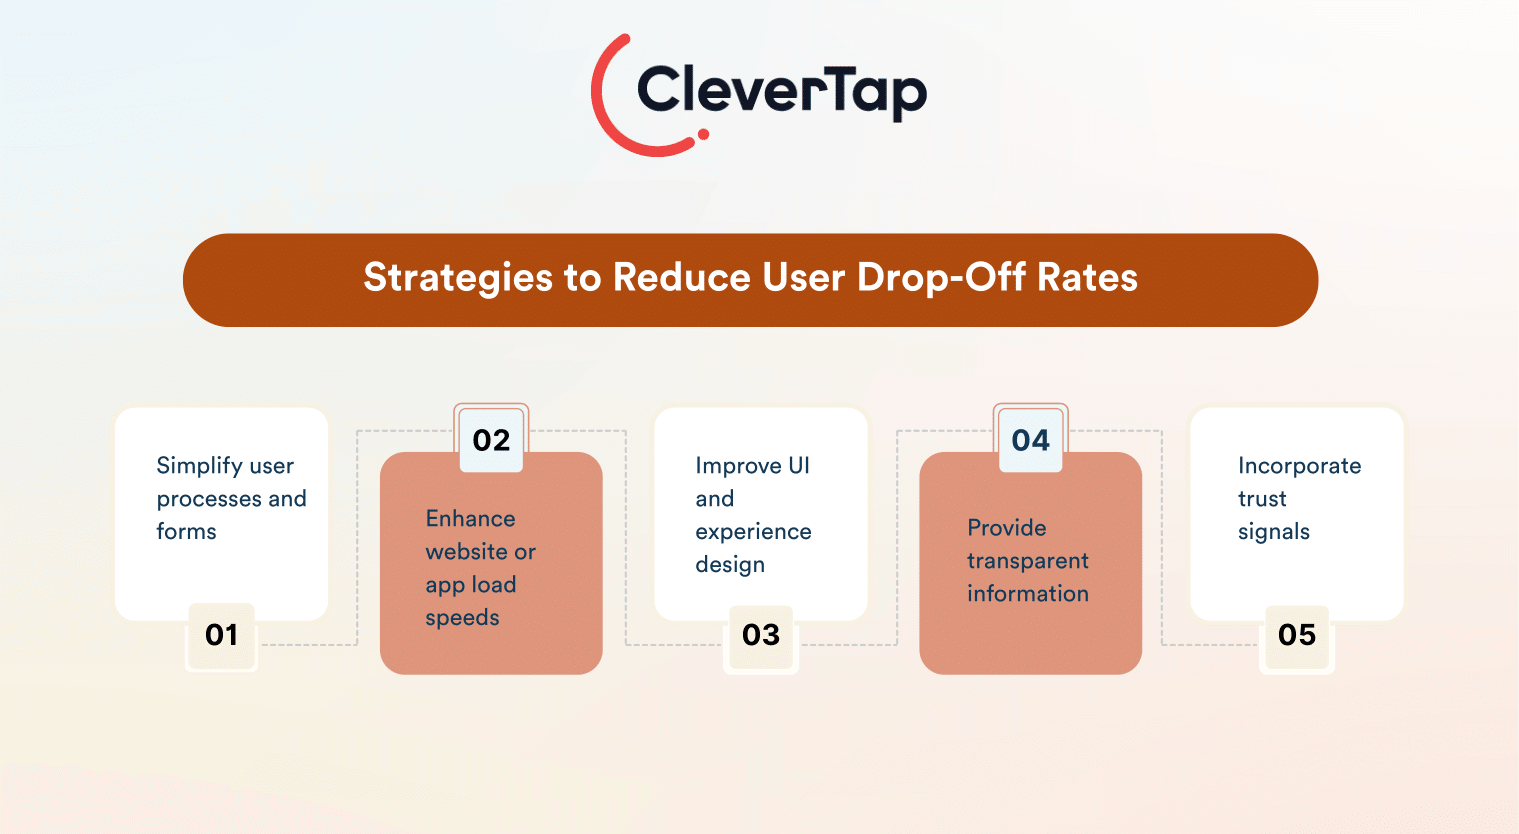
Simplify User Processes and Forms
Wherever possible, streamline the steps required for the user to complete the goal. Remove unnecessary form fields and try to condense multi-step flows.
For example, if account creation requires email verification, allow users to continue the process and verify later, rather than halting them mid-flow. A shorter, simpler process means fewer opportunities for users to abandon it.
Enhance Website/App Load Speeds
Speed is crucial. Long load times or laggy transitions between steps will test users’ patience. Optimize your site or app performance to ensure pages (especially critical funnel pages) load quickly.
Faster load times create a smoother experience, which can significantly reduce the number of users who drop off due to impatience or timeouts.
Improve User Interface and Experience Design
Invest in a clean, intuitive UI for your funnel pages. Use clear calls-to-action (CTA buttons), readable text, and a logical layout that guides users step-by-step. Make sure each step of the process has clear instructions or indications of what to do next.
Including a progress bar or step indicator in multi-step processes can also motivate users to finish (they can see how close they are to completion). Overall, a user-friendly design keeps people engaged and less likely to quit out of confusion.
Provide Clear and Transparent Information
Be upfront with information that matters. If there are costs, requirements, or next steps the user should expect, tell them in advance. Clearly communicate the value proposition and remind users why they should complete the process.
For instance, highlight the benefits of signing up or provide a summary of the order before final confirmation. When users understand what they’re getting and there are no unwelcome surprises, they’re more likely to stick through to the end.
Incorporate Trust Signals Like Testimonials and Security Badges
Adding elements that build trust can reassure hesitant users. Display security badges (SSL certificates, payment processor logos) at checkout to show that the transaction is secure. Include customer testimonials, reviews, or usage statistics to reinforce that others have successfully taken this action and benefitted.
Trust signals reduce anxiety and doubt, which in turn reduces drop-offs. For example, showcasing a few positive customer quotes near a sign-up form can give prospects confidence to continue. Similarly, clear refund policies or guarantees can help users feel safe completing a purchase rather than abandoning the cart.
Tools for User Drop-Off Rate Analysis
Identifying where users drop off and diagnosing why is much easier with the help of analytics and feedback tools. Marketing professionals have an array of tools at their disposal to conduct drop off analysis. Here are some categories of tools and how they help:
CleverTap’s Funnel Analysis to Identify and Reduce User Drop-Offs
CleverTap’s funnel analysis enables marketers to visualize user journeys by defining up to eight sequential events—such as App Launched → Product Viewed → Added to Cart → Charged. This helps identify exactly where users drop off. Funnels can be customized using event or user profile properties, with segmentation options (e.g., geography, cohort) to uncover granular insights.
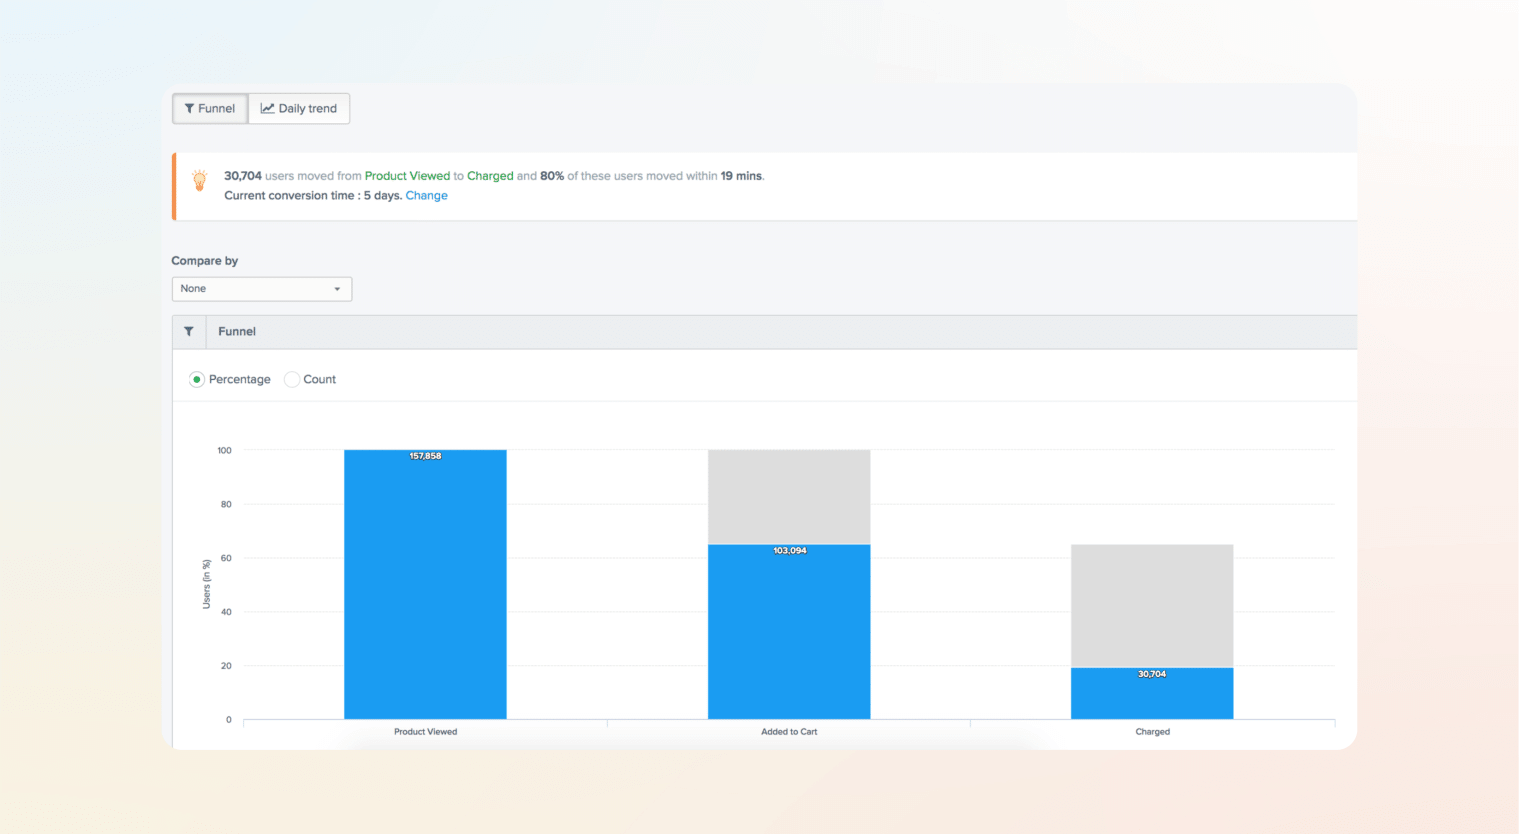
Source: CleverTap
Marketers can choose between two computation modes:
- Default: Allows flexible event sequencing.
- Strict: Requires exact event order.
Time-based insights, like conversion windows and “time to convert” graphs (cumulative and absolute), highlight how quickly users move through stages. This helps identify delays and trigger timely interventions—like campaigns to re-engage stalled users.
Additional features include frequency charts and daily trend views to monitor behavioral changes and spot friction points. Crucially, CleverTap lets you launch targeted campaigns directly from the funnel view, enabling swift, data-driven actions to reduce drop-offs and increase conversions.
How Akseleran Saw a 14% Increase in Month 1 Retention Using Funnels and Campaigns
Akseleran, a peer-to-peer lending platform in Indonesia, was facing significant user drop-offs—particularly after users made their first investment. Many users were not returning or transacting again, leading to poor Month 1 retention rates and stalled growth.
To tackle this, Akseleran partnered with CleverTap to analyze the user journey using funnel analysis. This helped them pinpoint exactly where users were dropping off. With those insights, they launched targeted engagement campaigns aimed at nudging users back into the app and encouraging key actions.

By addressing drop-off points with personalized campaigns, Akseleran achieved a 14% increase in Month 1 user retention, effectively reducing churn and boosting long-term engagement.
Read the full case study here.
Heatmaps and Session Recording Tools: Visualizing User Engagement
To understand why users drop off, qualitative tools like heatmap and session recording software are extremely valuable. Heatmaps provide a color-coded overlay on your pages to show where users click, scroll, or hover. Session recordings (also known as session replays) let you watch anonymized videos of actual user sessions on your site or app. By reviewing recordings, you might observe patterns: for example, many users moving their mouse around trying to find a “Next” button or repeatedly clicking an unresponsive element, indicating frustration points that lead to abandonment.
These tools bridge the gap between the numbers and the user experience. When you see drop-off analysis in action through a user’s eyes, it becomes clearer how to fix the design or content to reduce friction. Many analytics suites combine funnels with session replay to tie the “where” of drop-offs to the “why” in the user’s journey.
A/B Testing Platforms: Experimenting with Process Improvements
Once you’ve identified friction points in your funnel, A/B testing becomes essential for validating which changes reduce drop-offs. Traditional tools let you create page or funnel variations and split traffic between them—for instance, testing a shorter checkout form against the original to see which drives higher completion rates.
CleverTap’s A/B Testing capabilities take this further by integrating experimentation directly into your app experience. You can test multiple variations of elements like button text, page layout, or form fields and instantly track their impact on engagement, conversions, and retention—all in real time. Want to test if fewer form fields reduce friction? Or whether adding a progress bar improves completion rates? With CleverTap, these hypotheses can be validated efficiently within your funnel context.
The key is to test one change at a time and ensure sufficient traffic for statistically valid results. Over time, this iterative process—identify → test → optimize → repeat—enables continuous UX refinement and measurable drop-off reduction.
Learn how CleverTap’s analytics suite can help you understand your user journey better and reduce drop-offs and churn.
Turning Drop-Off Rate Insights Into Opportunities
User drop-offs are an inevitable part of any funnel, but with careful analysis and targeted strategies, you can drastically reduce their occurrence. By monitoring drop-off rates at each stage of your user journey, you gain actionable insights into the health of your marketing funnel.
Take a close look at your user data: find where your funnel drop off rate is highest, investigate why users might be leaving, and apply the strategies discussed to win those users back.
Mrinal Parekh 
Leads Product Marketing & Analyst Relations.Expert in cross-channel marketing strategies & platforms.
Free Customer Engagement Guides
Join our newsletter for actionable tips and proven strategies to grow your business and engage your customers.
