and Unlock Actionable Insights in Real-time
Ingest data from diverse sources like web, CRM, app, and more for deeper insights. Harness granular data over an extended lookback period with TesseractDB™, for contextual and trusted customer engagements.
Utilize analytics tools like cohorts, funnels, trends, pivots and more. Gain insights into user behavior and measure campaign impact for informed decision making.
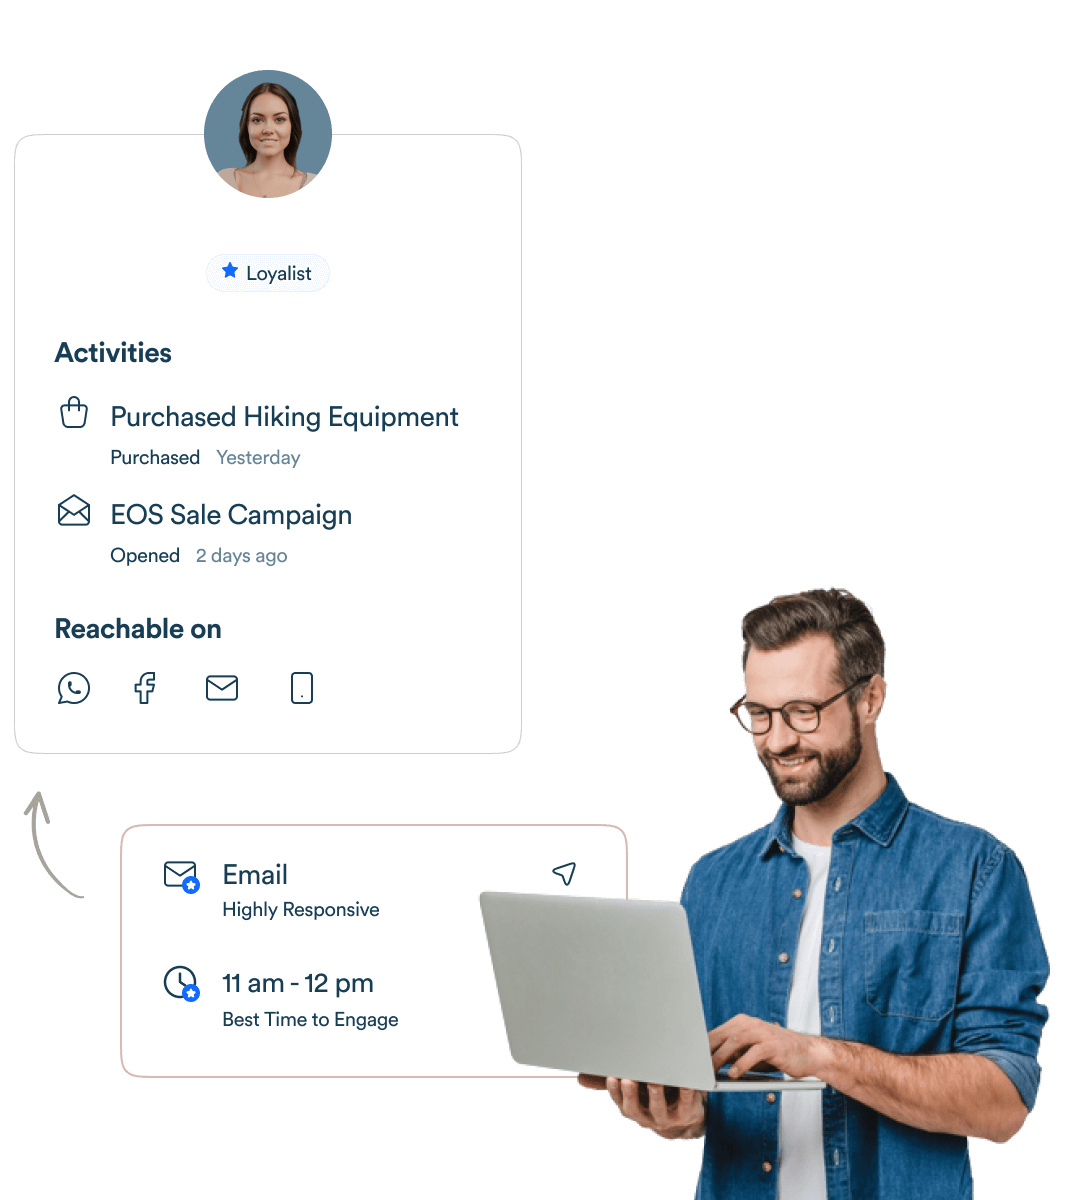
Watch demoCreate micro-segments based on past behavior, real-time actions and interests. Identify advocates and at-risk customers based on recency, frequency and value for personalized engagement.
Set engagement goals and get instant predictions on the likelihood of achieving them with our Clever.AI segmentation model. Track the progress with intuitive graphs and plan campaigns effectively.
Learn more